
AI Financial Reports from Your ERP: Reliable and Auditable
Claude Data is now available to everyone and shows the query behind every chart. Here's how to generate AI financial reports from your ERP with a read-only replica, role-based permissions, and reconciliation against the trial balance.

On November 10, 2026, Anthropic made Claude Data available to all of its customers. Every chart it generates shows the query that produced it and the time of the last refresh. For finance teams, this puts AI financial reports connected to the ERP within reach of anyone on the team, and it comes with a clear risk: numbers that nobody reviewed and that don't reconcile with the books.
The answer for CFOs and controllers is this: connect AI to a read-only replica of the ERP and document the chart of accounts and cost centers. Then require four controls on every report: a visible query, a cutoff date, role-based permissions, and reconciliation against the trial balance.
If you've already read our guide to Claude Sheets, Meetings, and Whiteboards or our article on AI-powered financial analysis, this is the next step: moving from exploring data to producing reports that can stand up to an audit.
What changed with Claude Data and what it means for finance
According to CASRAI, Claude Dashboards has been renamed Claude Data and is now available to all customers. It's enabled by default on Team plans and will be enabled by default on Enterprise on November 20. If your company is on Enterprise, confirm that date with Anthropic. From then on, any user with access will be able to build charts with company data, whether or not internal rules are in place.
One day earlier, Anthropic launched the Fable 5.2 and Mythos 5.2 models. On its announcements page, the company presents them as a new level in coding, finance, and science; MacRumors also reported the launch.
A more capable model writes better analysis, but it doesn't guarantee the number is correct. That depends on what data it reads, which definitions it uses, and who reviews the output. What makes Claude Data valuable for finance is that the query stays visible and a controller can verify it, as long as there's a process in place to do so.
Recommended architecture for AI financial reports
For an AI tool connected to your ERP to be reliable, we recommend this architecture. It's vendor-agnostic: it works with Claude Data, Gemini Enterprise, or an in-house build.
ERP → read-only replica → chart of accounts and cost centers → AI tool
- ERP: remains the official source of truth. The AI doesn't write to it or query it directly.
- Read-only replica: a copy that refreshes on a set schedule, for example every night and at close. It protects ERP performance and records the cutoff date.
- Chart of accounts and cost centers: describes each account, its SAT grouping code, and its cost center. It also defines how each metric is calculated, such as operating expenses or gross margin. Without this layer, the AI interprets the data its own way.
- AI tool: only sees the replica and the chart of accounts, with role-based permissions.
How to implement it step by step
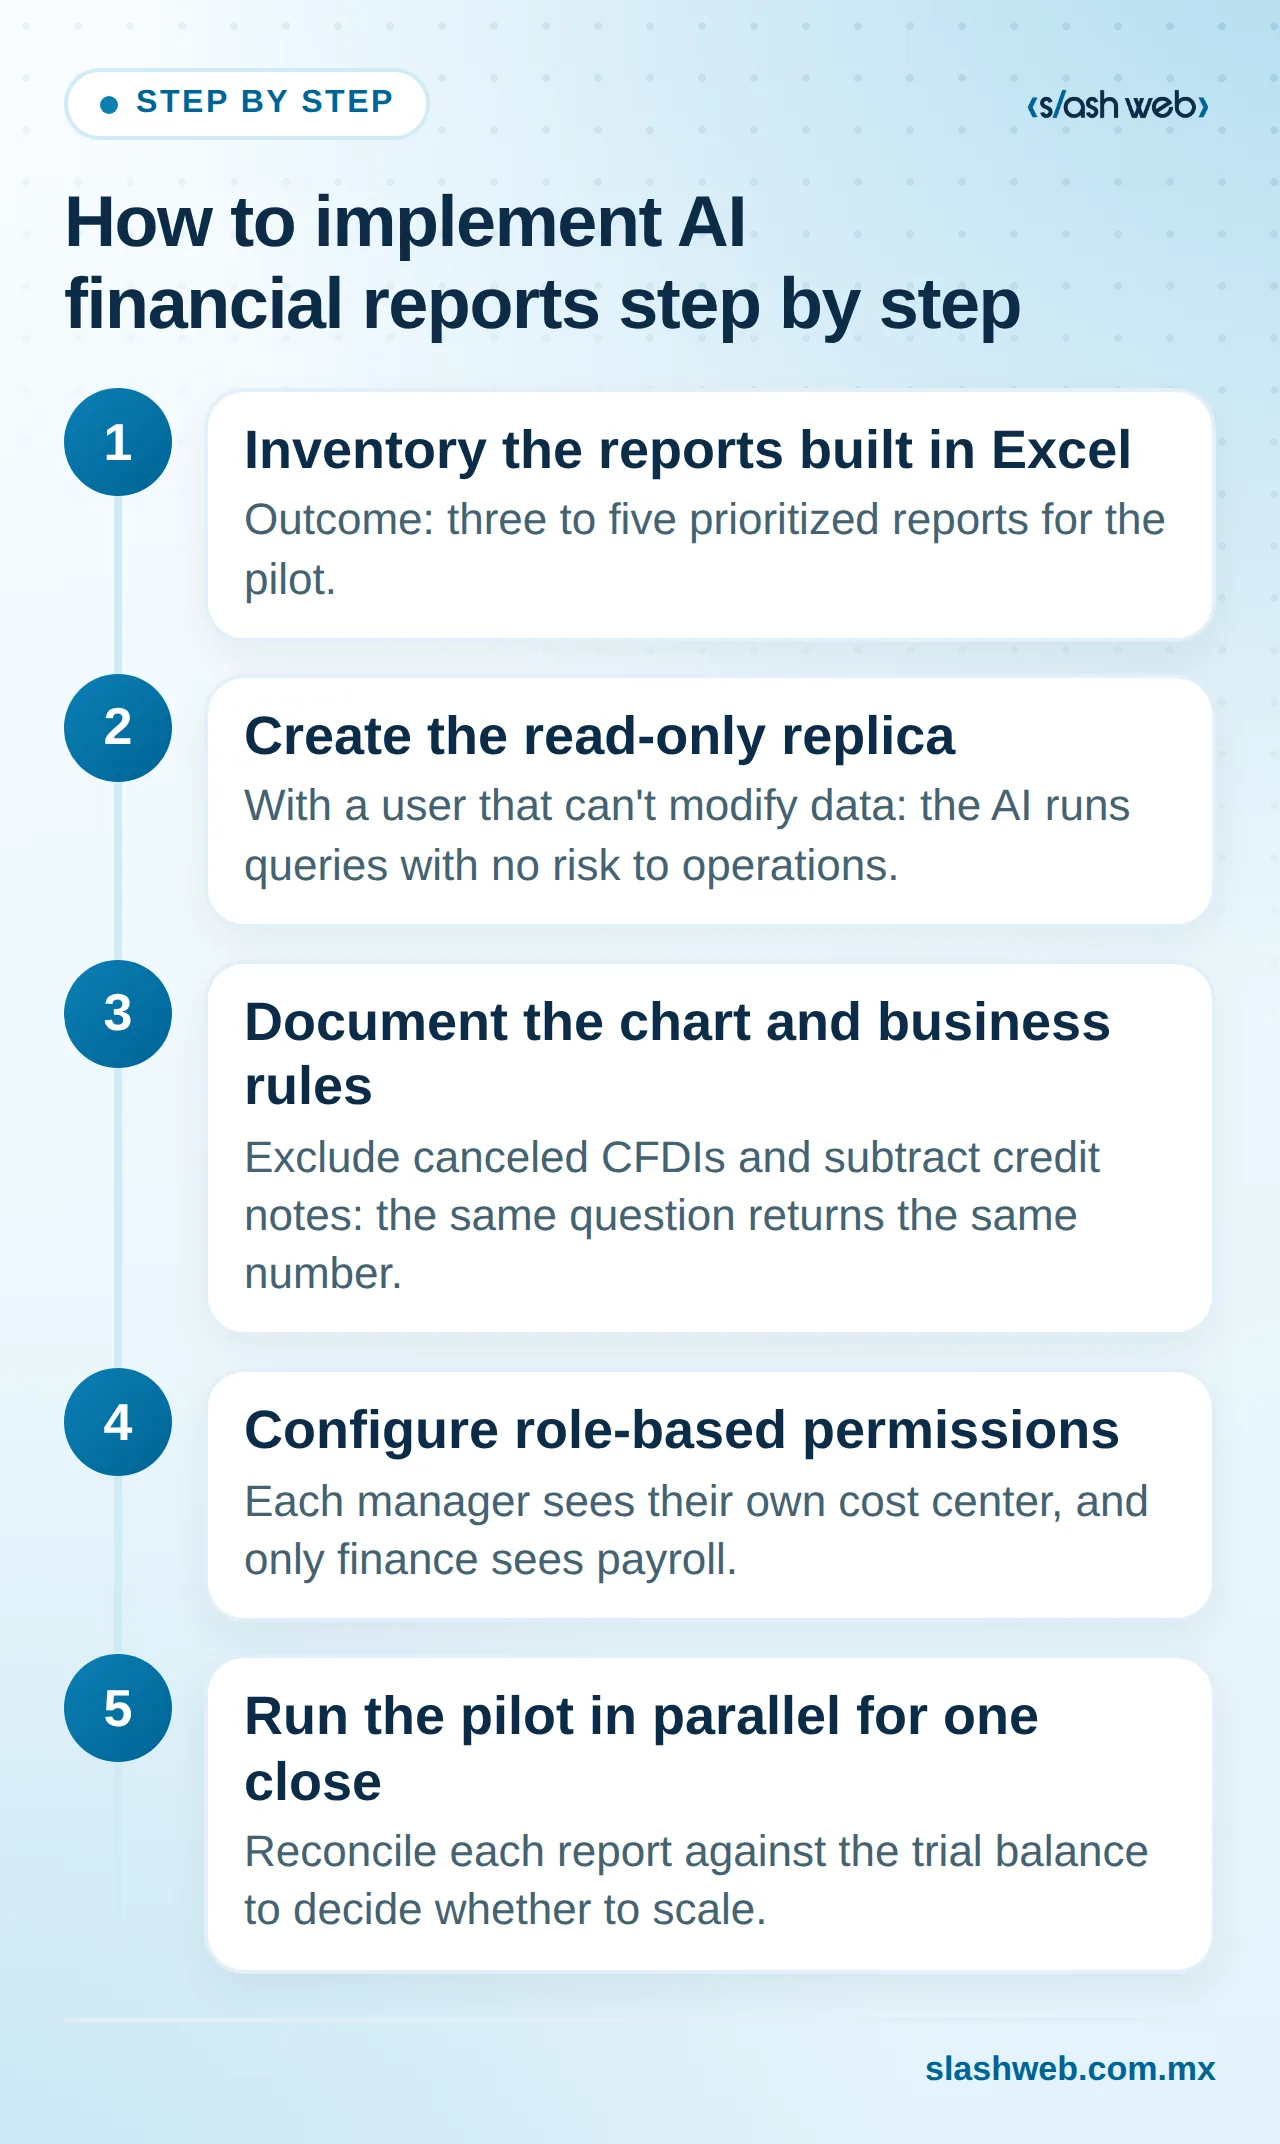
- Inventory the reports currently built by hand in Excel: who requests them, which module they come from, and how often. Outcome: three to five prioritized reports for the pilot.
- Create the replica with your IT team or your ERP vendor, using a user account that can't modify data. Outcome: the AI runs queries with no risk to operations.
- Document the chart of accounts and business rules, such as excluding canceled CFDIs and subtracting credit notes. Outcome: the same question returns the same number, no matter who asks.
- Configure role-based permissions before opening access: each manager sees their own cost center, and only finance sees payroll. Outcome: nobody accesses information they shouldn't.
- Run the pilot in parallel with your current method for one full close and reconcile each report against the trial balance. Outcome: evidence to decide whether to scale.
Minimum controls for an auditable report
A report is auditable when someone else can reproduce the number from the same source and the same cutoff. Before sharing a chart outside of finance, verify:
- I read the query and confirmed it uses the replica, not the production ERP.
- The cutoff date and refresh time match the reporting period.
- The total reconciles against the trial balance for the same cutoff, or the difference is explained in writing.
- The person running the query only sees the cost centers assigned to them.
- The query, the cutoff, and the reviewer's name are saved with the report.
Decisions you don't delegate to AI
AI explains, summarizes, and flags variances. These decisions stay with an accountable person:
- Closing figures: the official number comes from the ERP after the close process and is signed off by the controller.
- Adjusting entries, reclassifications, and accruals: AI can suggest them, but posting them requires accounting judgment.
- Information for third parties: anything going to the SAT, banks, the board, or auditors goes through review and sign-off.
- Materiality: a person decides whether a difference is significant or warrants investigation.
Use cases: received CFDIs and spend vs. budget
Two use cases work well as a starting point, because the data already exists in the ERP and in the XML files of received CFDIs:
- Spend variances by vendor: match received CFDIs by the issuer's RFC against expense accounts. This shows which vendors explain the month's increase.
- Spend vs. budget by cost center: compare actuals against budget. Then ask the AI to explain the largest variances using the journal entries that support them.
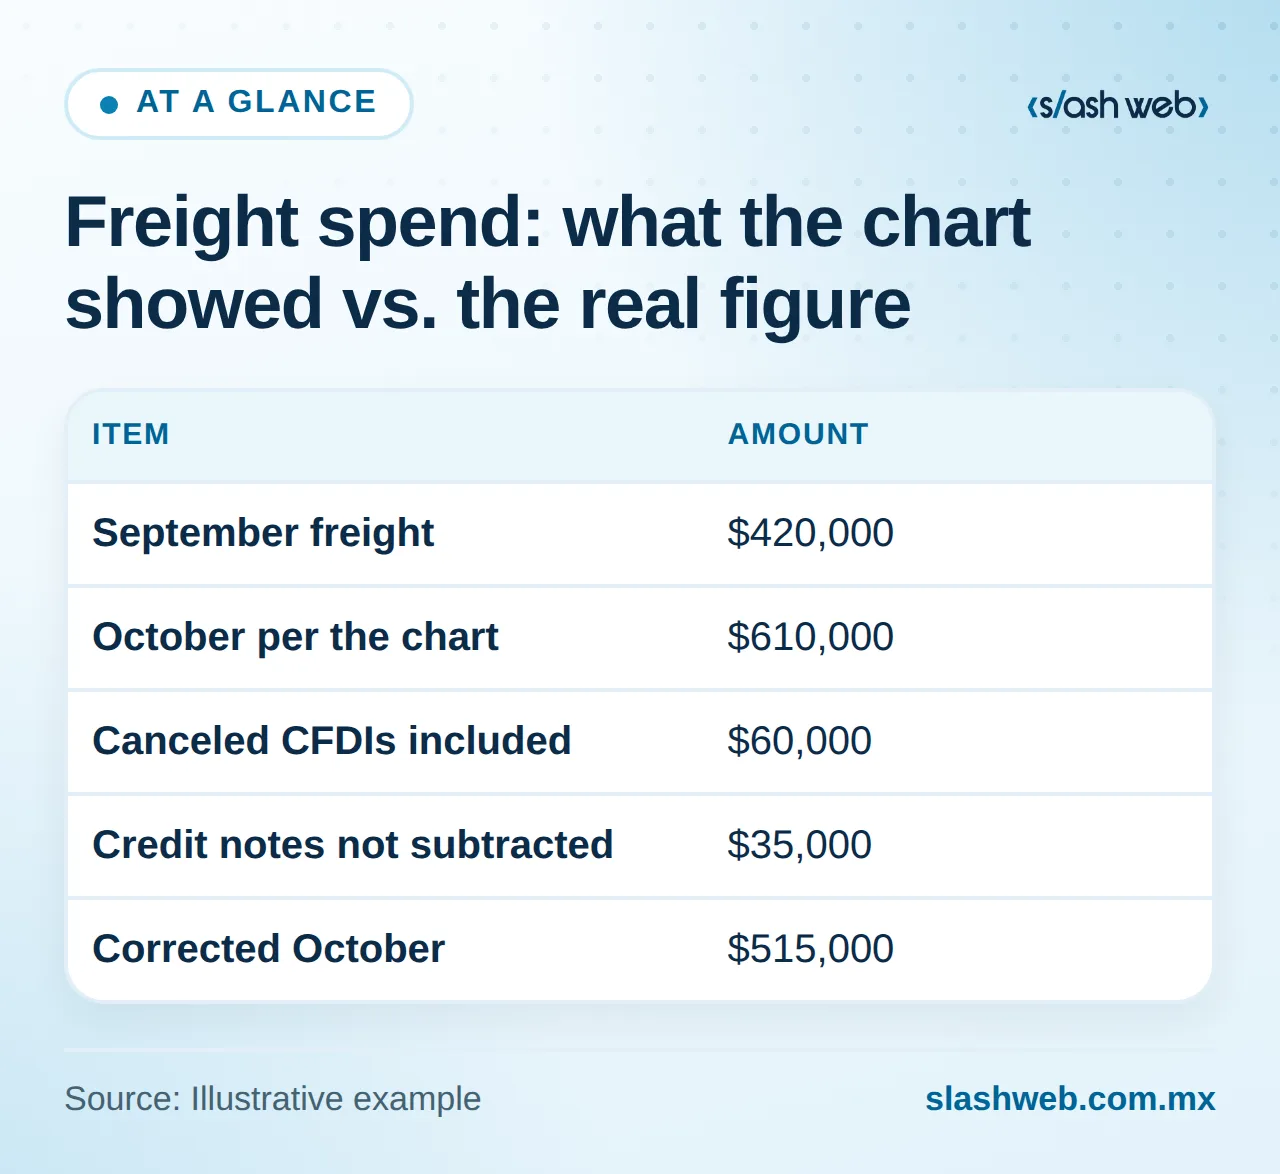
Illustrative example (hypothetical figures): a distributor compares October freight spend against September. The chart shows an increase from $420,000 to $610,000. Reading the query, the controller sees it includes $60,000 in canceled CFDIs and doesn't subtract $35,000 in credit notes. Once corrected, the figure is $515,000 and it reconciles against the freight account in the trial balance: the real increase is $95,000, not $190,000. Against a $480,000 budget, the variance is around 7%. Without the visible query, the meeting would have debated a problem twice its actual size.
These rules should live in the chart of accounts. Applying them day to day can be handled with AI process automation.
Off-the-shelf tool, custom integration, or traditional BI
Here's how an off-the-shelf tool (Claude Data or Gemini Enterprise), a custom integration, and traditional business intelligence compare:
| Criterion | Off-the-shelf tool | Custom | Traditional BI |
|---|---|---|---|
| Setup | Fast if you already have the plan | Requires development | Requires dashboard design |
| New questions | Open-ended, in natural language | Open-ended, within your rules | Require a new dashboard |
| Traceability | Claude Data shows query and time | Audit log you define | High on fixed reports |
| Tax and close rules | Documented in the chart of accounts | Built into the code | Built into the model |
| Best for | Team exploration | Recurring, critical reports | Stable KPIs |
These options aren't mutually exclusive. BI can keep publishing the official KPIs, while the off-the-shelf tool lets the team explore. Custom software development makes sense when a report is recurring, feeds the close, or needs tax rules you don't want to re-explain with every question.
Common mistakes and how to avoid them
- Connecting AI to the production ERP. Always use the replica to avoid slowdowns and write risk.
- Opening access before defining roles. If your plan has the feature enabled by default, configure permissions first.
- Mixing dates. Define in the chart of accounts whether to use the CFDI issue date or the journal entry's posting date.
- Treating the chart as the official number. Treat it as analysis until it's reconciled and signed off.
What to do this week
- Review your Claude settings if your company uses Team or Enterprise. Confirm whether Claude Data is enabled and who can connect data sources; on Enterprise, also verify the November 20 date.
- Write the definition for one recurring report, such as spend vs. budget: accounts, cost centers, cutoff date, and CFDI filters.
- Ask IT whether a read-only replica or user for the ERP already exists and how often it refreshes.
Conclusion
AI financial reports are now within reach of any team, and that's good news only if every number can be traced back to its source. Reliability doesn't come from the model. It comes from the architecture, with a read-only replica and a documented chart of accounts, and from four controls: a visible query, a cutoff date, role-based permissions, and reconciliation against the trial balance. AI speeds up analysis, but a person still signs off on the closing number.
At Slashweb, we design AI integrations connected to ERP systems for companies in Mexico and the United States. If you want to know how ready your data and controls are, request an assessment of financial reporting connected to your ERP. We'll review the architecture, permissions, and first pilot report with you.
Frequently asked questions
Can I generate AI financial reports if my ERP is on-premises or several years old?
Yes. The AI doesn't need to connect to the ERP itself, but to a replica or staging database fed by scheduled extracts. What matters is reviewing how the data is extracted and how often, so the cutoff date of every report is clear.
Do I need a data warehouse before getting started?
Not necessarily. For a pilot with a few reports, a read-only replica and a well-documented chart of accounts are usually enough. A data warehouse makes sense when you combine multiple sources, such as ERP, CRM, and payroll, or when query volume grows.
How do I protect confidential financial information when using an external AI tool?
Start by reviewing your plan's terms with the vendor: data retention, use for training, and who manages access. Then limit the replica to the data the reports actually need and leave out, or mask, sensitive information such as individual payroll. Security depends as much on the contract as on what you choose to expose.
Who should own AI-generated reports: finance or IT?
Finance should own the definitions, review, and sign-off of every report, because it is accountable for the numbers. IT manages the replica, access, and data refreshes. It's a good idea to name one person from each area and document in writing who approves changes to the chart of accounts.
Slashweb
Want to apply this in your company?
Book a free call with a specialist and get a tailored proposal.